Improving Data Visualizations in the Flightscope (FS Golf) App
- Daniel Nunez
- Jan 22, 2025
- 3 min read

As a golfer, I recently examined the Flightscope app, which offers golfers real-time data about their swings, ball flight, and overall performance. While the app is packed with valuable information, its visualizations leave room for both praise and critique. Keep in mind that the app is designed to be used for a wide range of products, from their $299 option up to $15,000 flagship unit, found here: https://flightscope.com/collections/sensors
What Story Is Being Told?
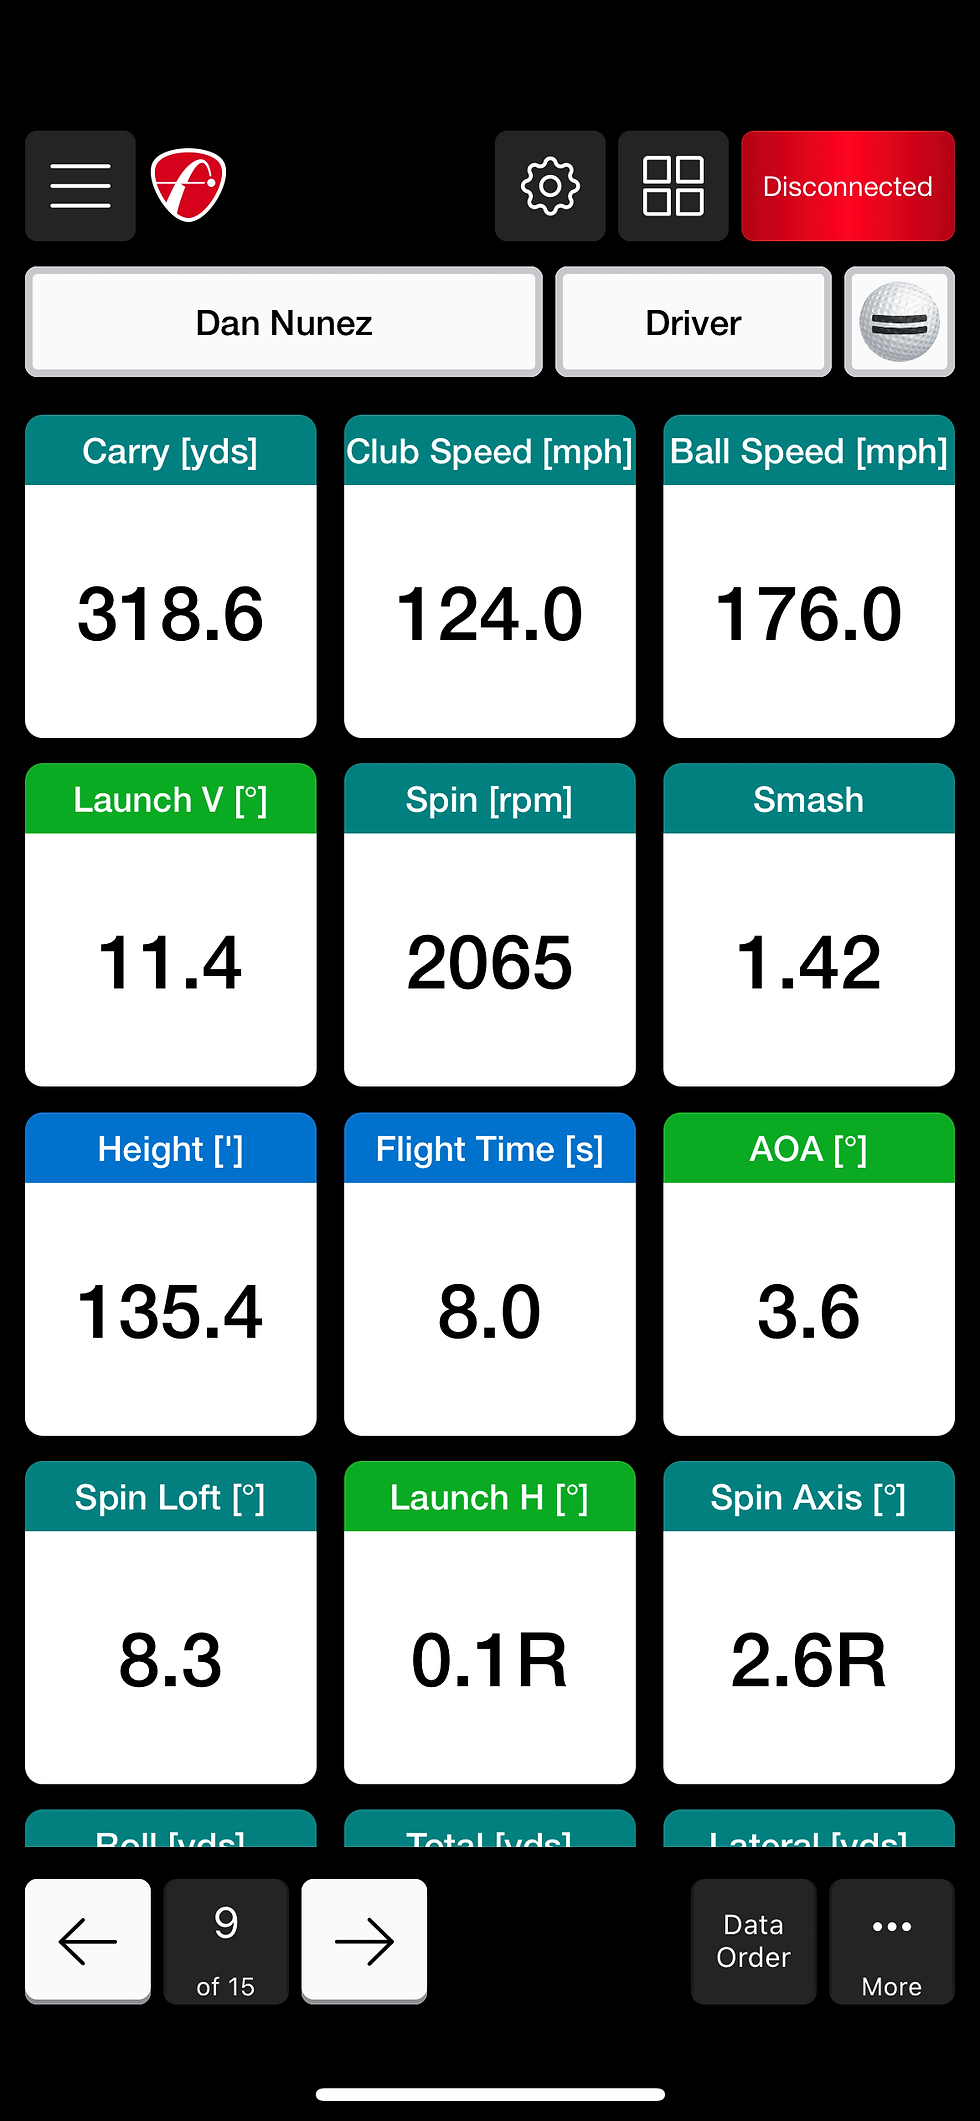
The Flightscope app visualizes swing and shot data to help players improve their game. Key metrics like ball speed, launch angle, spin rate, carry distance, and shot dispersion are displayed in various formats, including tables, grids, and 3D flight paths. The goal is to provide golfers with actionable insights for better performance.
What Makes It Effective?
Comprehensive Metrics: The app does an excellent job of providing all the necessary data points in one place. For advanced golfers, this is invaluable.
3D Flight Path: The 3D flight visualization helps golfers see the trajectory of their shots, making it easier to analyze ball flight characteristics.
Shot Dispersion Chart: By showing where each shot lands in relation to the target, the app highlights patterns that could indicate consistency issues or swing flaws.
Customizability: Users can filter data by club or session, enabling focused analysis.

What Makes It Ineffective?
Cluttered Display: The sheer amount of data can be overwhelming, especially for beginners. The visuals often lack hierarchy, making it difficult to prioritize which metrics to focus on.
Color Choices: The use of similar colors for different data points (e.g., green for carry distance and blue for height ) can be confusing.
Limited Comparative Context: While the app shows a golfer’s data, it doesn’t always compare it to relevant benchmarks like averages for skill levels, weather conditions, or course difficulty.
3D Limitations: The 3D flight path is visually appealing but sometimes impractical on smaller screens, as details like spin axis or landing angle are hard to discern without zooming.
Are There Data Fallacies or Inaccuracies?
One potential issue is how the app presents shot dispersion. By focusing on averages and patterns, it may downplay outliers, which could skew a golfer's perception of consistency. Additionally, without clear annotations about environmental factors like wind or elevation, users might misinterpret performance.
Are There Other Questions the Visualization Causes?
How does my performance compare to players of a similar skill level?
Can the app incorporate real-time weather data to contextualize results?
Could historical trends be shown to track long-term improvement?
How Would You Improve It?
Simplify the Interface: Create a “beginner mode” with only the most essential metrics, such as carry distance, ball speed, and accuracy, while hiding advanced stats unless toggled.
Use Color-Coded Zones: For visuals like shot dispersion, employ heatmaps or clear zones to indicate success ranges versus misses.
Add Benchmarks: Provide contextual data, like comparisons to tour averages or recommended ranges based on the user’s handicap.
Enhance 3D Usability: Allow toggling between 3D and 2D views for better clarity on small screens.
Interactive Insights: Introduce pop-ups that explain metrics in layman’s terms and offer actionable tips to improve problem areas.
Incorporate Environmental Context: Overlay weather data, such as wind speed and direction, to give users a complete picture of their performance.
The Flightscope app has tremendous potential to elevate a golfer’s game, but its visualizations could be enhanced for greater accessibility and impact. By focusing on clarity, context, and personalization, the app could appeal to golfers of all skill levels while providing more meaningful insights.


Comments